


Put a vLLM pod under 50 concurrent requests and watch what the metrics say. The pod runs at 5 to 8 percent CPU. Its GPU sits at 95 percent. To the Horizontal Pod Autoscaler, which decides on CPU and memory utilization, that pod is healthy and will not grow. Your users meanwhile watch time-to-first-token climb as the KV cache fills and requests stack in a queue the HPA cannot see. 1
That mismatch, where the autoscaler's picture of the world and the workload's real stress diverge, is why standard HPA breaks on LLM inference. Inference is GPU-bound, and cold start is minutes, not seconds, so every scale event carries a latency price. Autoscaling an inference workload is a different problem from autoscaling a web tier. It needs a different signal, a different scaler, and a deliberate answer to how many warm replicas you can afford to keep. This is the operational layer the serving stack assumes and the model gateway routes over: how the fleet that actually holds your models grows and shrinks.
Why HPA breaks on inference
Kubernetes HPA is built on a model of resources that inference violates. It treats CPU and memory as the demand signal, which works when a service is compute-bound or memory-bound in a way the scheduler can see. A vLLM replica under real load is neither. Token generation is GPU-bound, so the CPU metric stays near idle no matter how saturated the hardware is. The result is an autoscaler that fires on the wrong trigger, or not at all, while the actual bottleneck builds up invisibly. 1
The second problem is what a scale event costs. When HPA finally does add a replica, that pod does not become ready in seconds. It pulls a container image, downloads or loads model weights, captures CUDA graphs, and warms its KV cache. On a cold cache a fresh inference pod spends minutes in this state, and the upstream replica carries the full load in the meantime. A web pod is cheap to replace, so scale events are routine. An inference pod is expensive to bring up, so every scale-out that fires late has already hurt users, and every scale-down you let run destroys warm capacity you will pay to rebuild. 12
The third mismatch is that inference batches differently than you might expect. A single vLLM replica with continuous batching behaves like a high-concurrency server, absorbing a large number of requests before it actually needs a sibling. PagedAttention cuts KV-cache memory waste from the 60 to 80 percent typical of naive serving to roughly 4 percent, which is what lets one GPU hold a bigger batch. So raw request count is not the right trigger either. A replica does not signal that it is full by request volume. It signals by its own queue starting to build. 2
The signal that works: queue depth plus an SLO guardrail
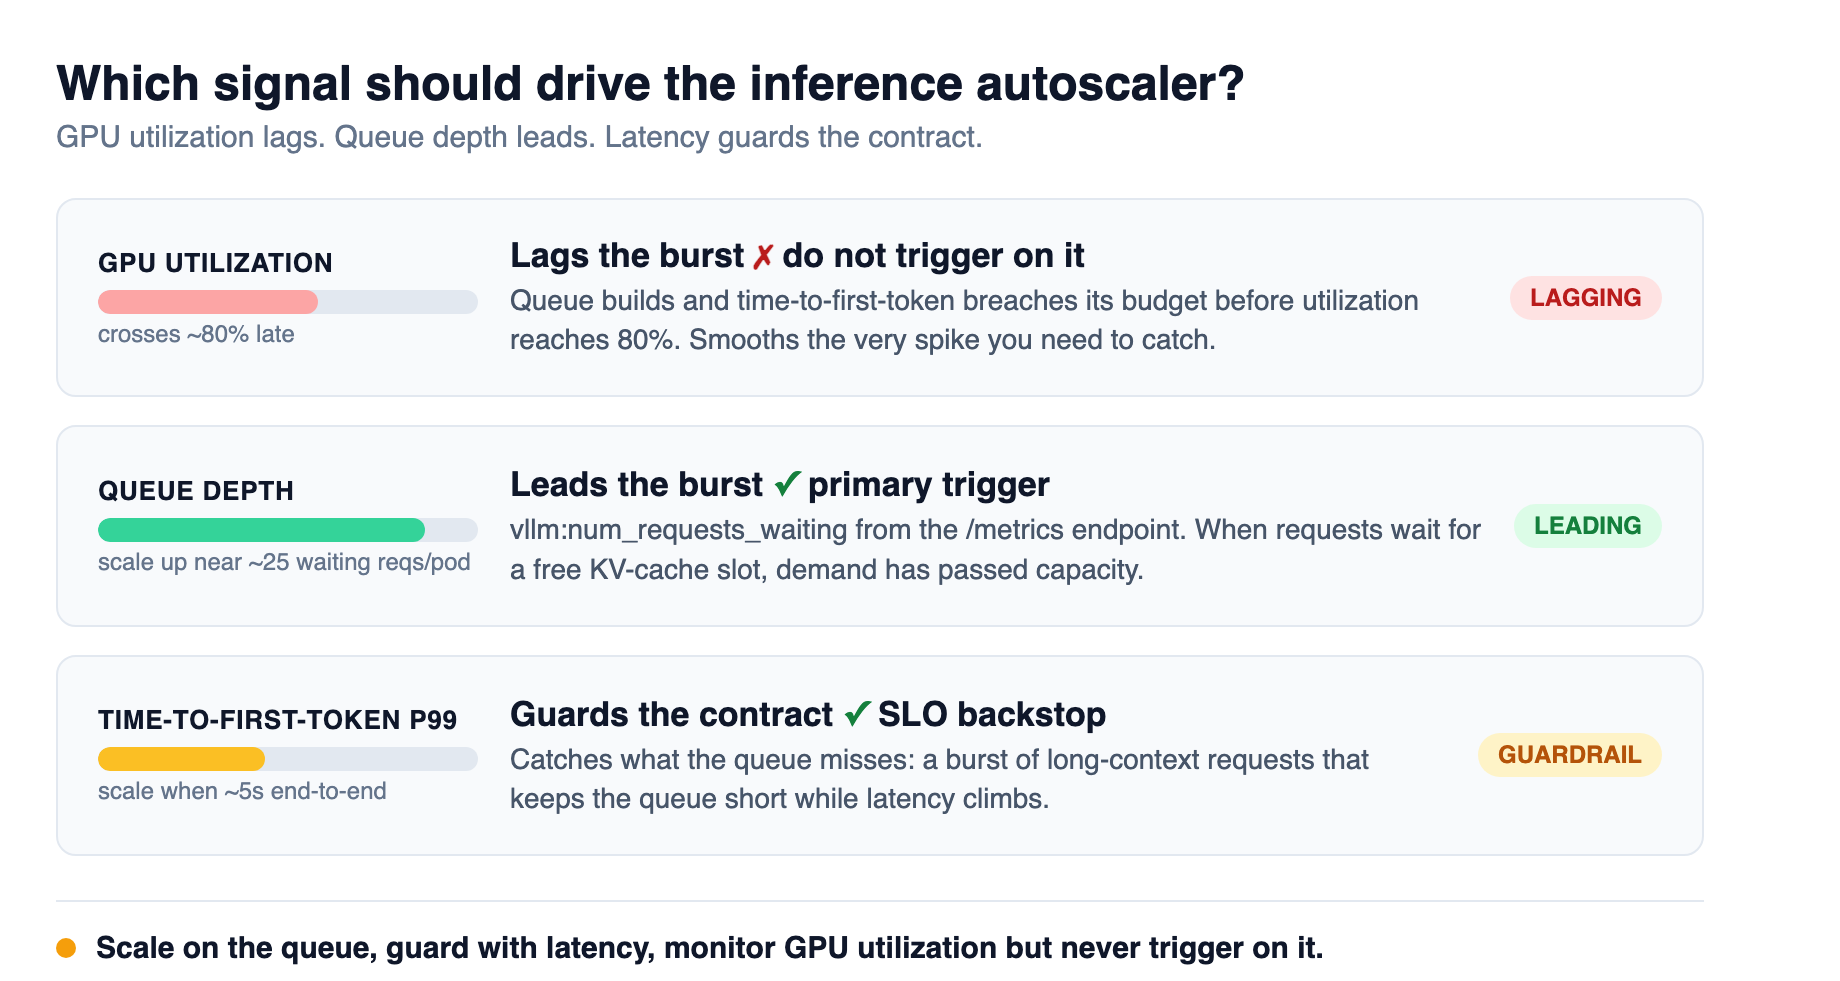
The metric that tells you a replica is out of headroom is its queue depth. vLLM exposes vllm:num_requests_waiting on a Prometheus endpoint, and that is the number to scale on: when requests are waiting for a free KV-cache slot, demand exceeds capacity. 32
A second trigger guards the user-visible contract. Scale on a latency percentile, typically p95 or P99 end-to-end, as an SLO backstop. A queue can stay short while a burst of long-context requests still pushes time-to-first-token past its budget, so pairing a latency threshold with the queue gives you both the leading signal and the trailing one. The official Amazon EKS guidance for this exact setup scales up when average queue depth exceeds roughly 25 waiting requests per pod, or when p95 end-to-end latency passes about 5 seconds, whichever comes first. 3
Two settings make this workable in practice. KEDA separates an activation threshold from the target threshold, so you can tell it to ignore a handful of stray requests and only wake the machinery when real demand arrives. That avoids the flapping that plagues naive scaling. And because inference scale-down is destructive, a long stabilization window on scale-down is worth more than a fast reaction on scale-up: you would rather keep a warm replica a minute too long than tear it down and rebuild it at the next burst. 32
GPU utilization looks like an appealing trigger and usually is not. It is a lagging signal for LLM workloads: time-to-first-token percentile often breaches its SLO budget before utilization reaches 80 percent, because queue depth builds during bursts that the utilization metric smooths over. Monitor it, absolutely, but do not scale on it. 1
Two layers, not one
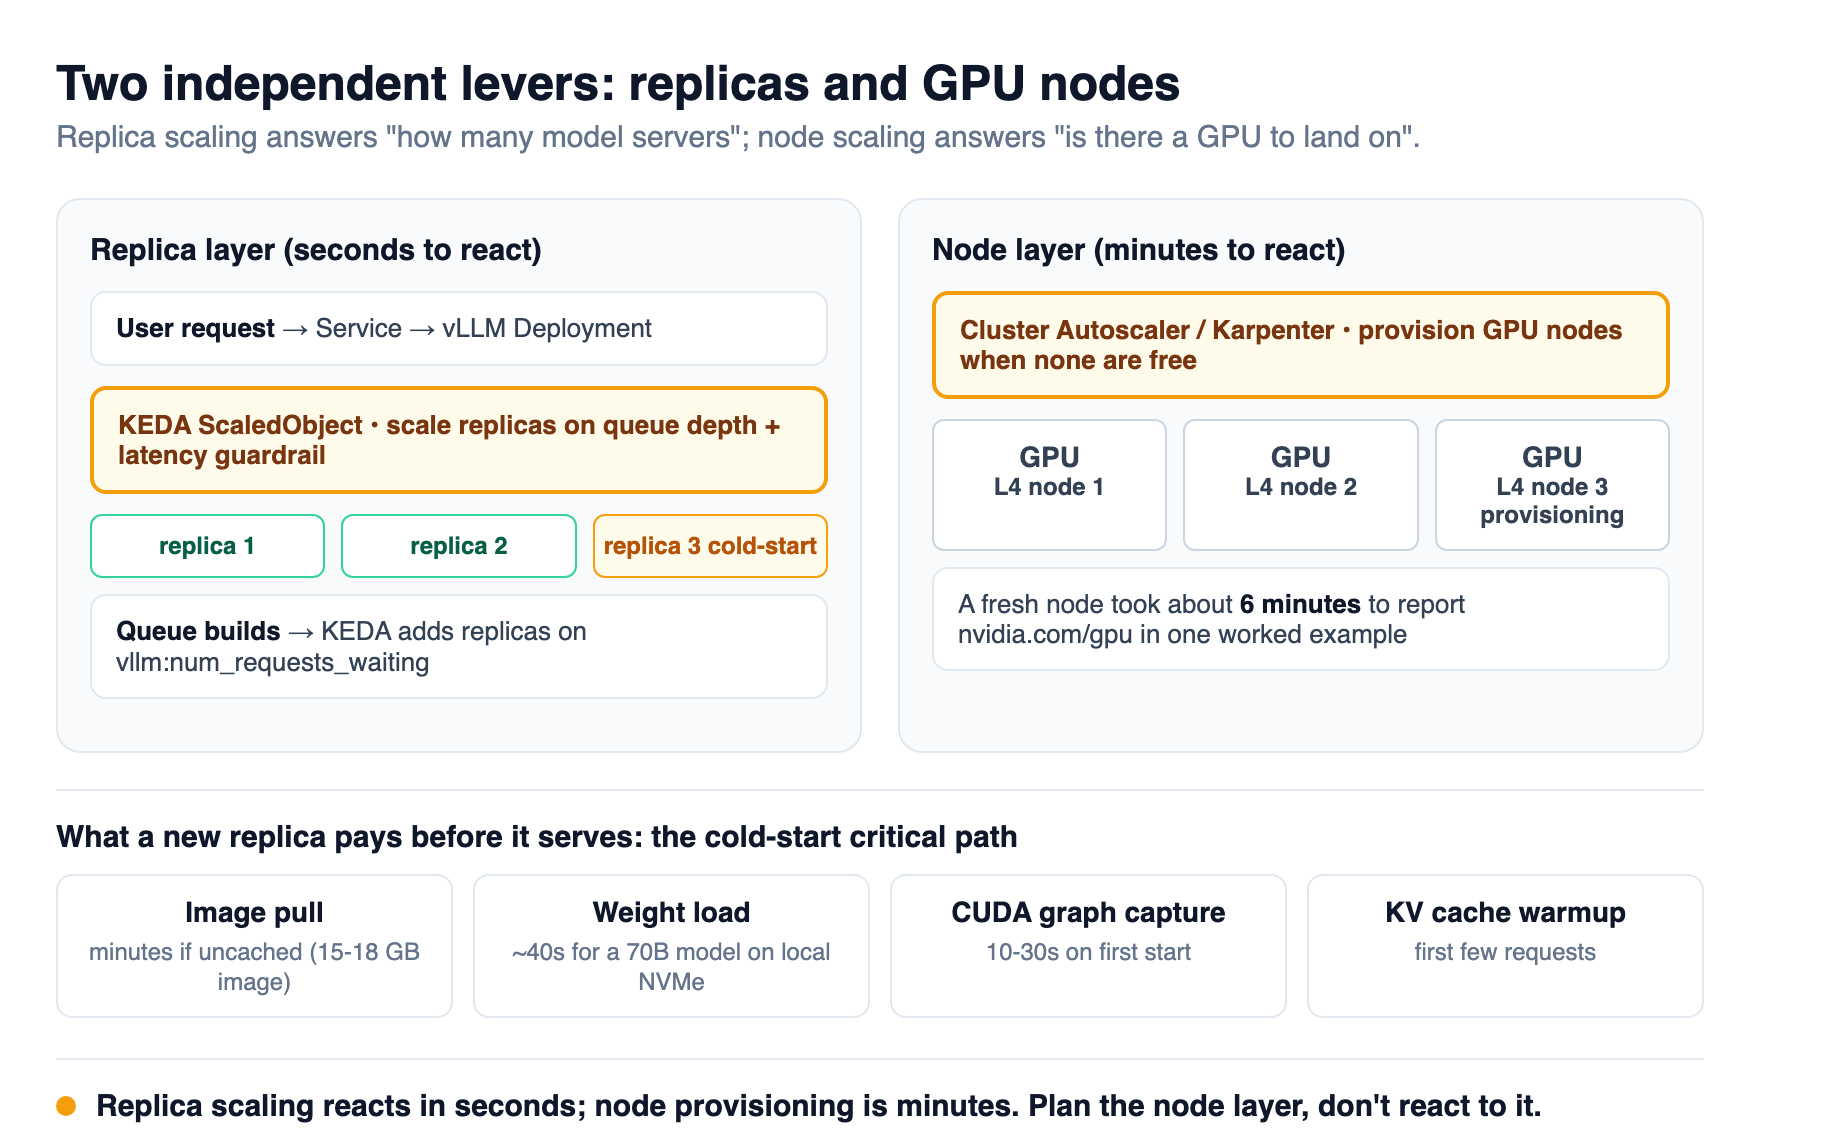
The single most useful shift is treating replica count and node count as two independent levers. Replica scaling changes how many model servers run. Node scaling changes whether there is a GPU for a new server to land on. They run on different time scales and answer different questions. 2
KEDA drives replica scaling on queue depth and your latency guardrail. When the queue grows, it asks the Deployment for more replicas. Those replicas schedule onto GPU nodes, and when the existing pool is full the Cluster Autoscaler or Karpenter provisions new nodes. A fresh GPU node is not instant: in one worked example an NVIDIA L4 node took about six minutes to provision and report nvidia.com/gpu as allocatable, on top of the replica's own cold-start time. Node scaling is the slow lever, and you cannot make it fast by tuning the replica layer, so you plan for it rather than react to it. 2
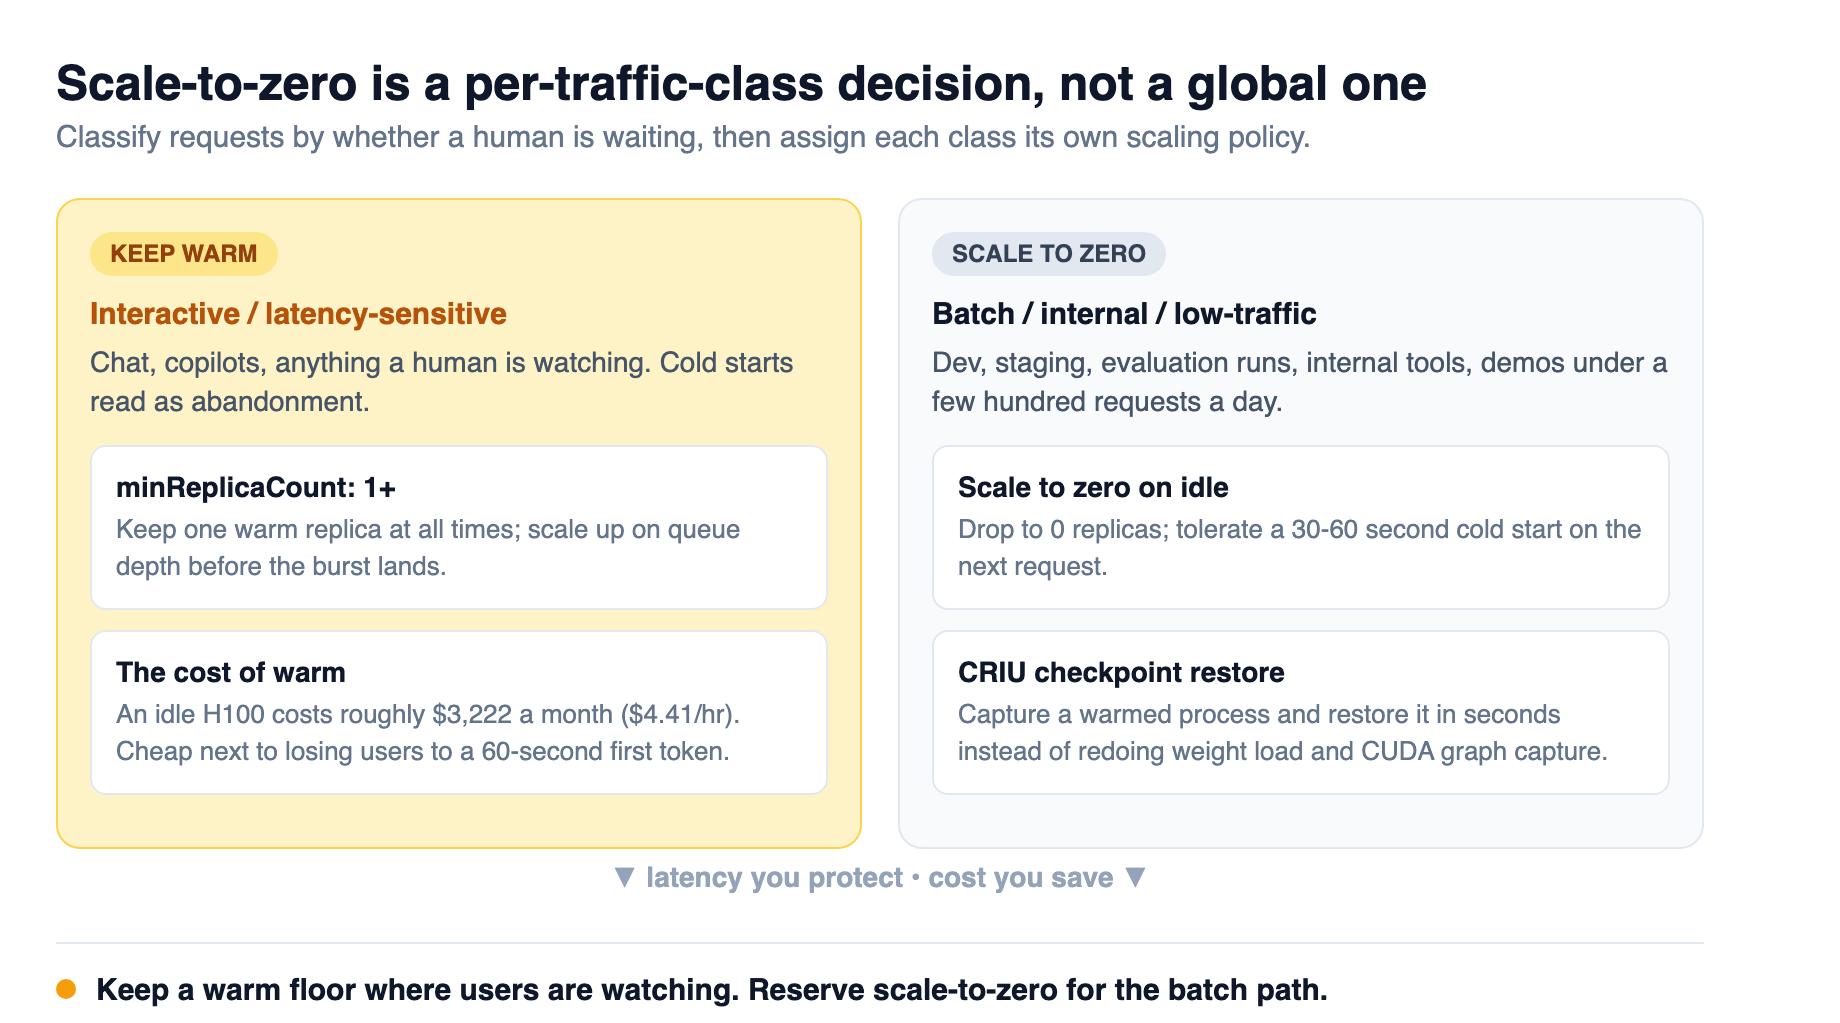
Keep minReplicaCount at one or above for anything latency-sensitive. Scale-to-zero is the tempting economy, but a replica that dropped to zero must pay the full cold-start cost when the first request of the burst arrives, which is exactly when you can least afford it. The real-world failure mode shows up in the pod list: a new replica stuck in ContainerCreating or Pending while the burst passes. 2
Scale-to-zero is an economy, not a default
Scale-to-zero does cut GPU cost, and the math is real. An idle warm replica is pure spend. At roughly $4.41 per hour for an H100, a replica left warm around the clock costs about $3,222 a month with nothing served. The question is when that idle cost exceeds the latency tax a cold start imposes. 1
The honest answer is that scale-to-zero pays on low-traffic, latency-tolerant paths: development endpoints, staging, internal tools, and demos that see a few hundred requests a day and can absorb a 30 to 60 second first response. It is not the right default for a user-facing production API, where those same seconds read as abandonment. The rule of thumb that falls out is to reserve scale-to-zero for the batch and offline class of traffic and keep a warm floor for the interactive class. 14
If you do scale an interactive endpoint to zero, Knative is the mechanism that makes it survivable. Its Activator buffers an incoming request while a pod cold-starts, then proxies it once the pod is ready, which turns a hard failure into latency. The trade is that Knative replaces your Service with a Route, changing how you address the endpoint. KEDA with its HTTP add-on also reaches zero but adds a reverse proxy to the request path, so you are paying with either extra moving parts or a different addressing model. There is no free scale-to-zero. 1
The painkiller for cold starts is checkpointing. CRIU can capture a warmed process, GPU memory and all, and restore it instead of redoing weight loading, CUDA graph capture, and KV warmup. On the Kubernetes side the ContainerCheckpoint API (beta and on by default since Kubernetes 1.30) exposes the trigger. The result drops cold start from 60 to 90 seconds down to a few seconds for small models, which is what turns scale-to-zero from a latency disaster into a real option. The requirements are specific, NVIDIA driver 550 or newer, CUDA 12.x, and cgroups v2, so verify the stack before you bet on it. 51
Cutting the cold-start tax before you scale
None of the scaling decisions matter if every new replica takes minutes to serve its first token, so the cold-start cost is worth attacking at the source. A cold start is four sequential phases, each with its own bottleneck, and each can be shrunk. 5
The biggest single lever is the container image. A full LLM serving image bundles CUDA, PyTorch, the serving framework, and every transitive dependency, commonly 15 to 18 gigabytes. Pulling that uncached takes four to eight minutes, which is the dominant term in the whole cold-start budget. A multi-stage build that strips build tools and ships only the runtime cuts the image to about 5 to 7 gigabytes, and pre-pulling that onto every node with a DaemonSet drops the pull phase toward zero. Container pull is minutes; everything else is seconds. 5
Then the seconds. Model weights load from storage, and where they sit decides how long that takes. A 70B BF16 model is roughly 140 gigabytes on disk. From local NVMe at a few gigabytes per second that is about 40 seconds; from network-attached storage at a few hundred megabytes per second it is minutes. Local NVMe locality matters more than a clever loader. When you do use a loader, the safetensors streaming path overlaps reading one shard with transferring the previous one to GPU, saving roughly 20 to 30 seconds on a 70B model by pipelining weight transfer. 5
Two more phases are pure recomputation you can cache. CUDA graph capture, where vLLM records and replays a fixed sequence of GPU operations, takes 10 to 30 seconds on first start, and a persisted graph cache makes subsequent starts skip it. KV-cache warmup, where the first few requests populate the prefix cache, is unavoidable but small, usually a handful of requests before hit rates stabilize. Persist the graph cache and keep weights on fast local storage and a cold start collapses from minutes to tens of seconds, which changes what scale-to-zero and aggressive scale-down are willing to give you. 5
Research points the same way. In a production serverless LLM platform, a cold-start instance produced its first token after more than 40 seconds while a warm instance took about 30 milliseconds per token, a gap so wide that a substantial fraction of the engineering effort in the area is dedicated to closing exactly this window, with reported cold-start reductions of 1.7 to 4.7 times. The latency you are protecting is not a nicety; it is the difference between a served request and an abandoned one. 6
What this means on the ground
We hit the boundary of all three of these lessons in our own delivery fleet, which runs a pipeline of autonomous workers that issue bursts of model calls. An early version let the inference replicas scale to zero on idle, which saved money most of the day and then silently added a multi-minute cold start to the first task of each burst. The downstream work did not fail; it just took so long to get its first token that it looked like a model failure, and the investigation pointed at the model before anyone thought to check the autoscaler. The fix was to separate traffic by class, keep a warm floor on the latency-sensitive path, and let only the batch path scale to zero. The transferable lesson, and the one we now apply every time we touch this stack, is that scale-to-zero is a per-traffic-class decision, never a global one. An external team needs none of our internal setup to act on it: separate your traffic classes, assign each one its own scaling policy, and budget cold start as a real cost. 34
That classification is the practical takeaway for any team shipping inference. Start by asking which requests can wait and which cannot. Interactive chat, copilots, and anything a human is watching get a warm floor and a queue-depth scaler with a latency guardrail. Batch jobs, evaluation runs, and internal calls scale to zero. Tune the node layer separately and plan for its minutes of provisioning. Then cut the cold-start tax with a slimmed, pre-pulled image and fast local weights, and you have an autoscaler that grows when demand actually builds and shrinks without giving away the latency you already earned.
The web tier problem was solved years ago: scale on the signal that predicts saturation, and replicas are cheap. Inference inverts both assumptions. The signal is the queue, the replicas are expensive to create and to destroy, and the autoscaler that respects those two facts is the difference between a model fleet that rides out a burst and one that watches it pass. Autoscale on queue depth. Guard with latency. Keep a warm floor where users are watching. And treat every scale event as a latency decision, because for inference it is.
Sources
-
Spheron, "GPU Inference Autoscaling with KEDA and Knative on Kubernetes: Cold-Start and Scale-to-Zero for LLM Serving," 2026. Covers why HPA fails on GPU-bound workloads, the cold-start phase table, the lagging-signal problem, Knative's Activator, CRIU restore, and the H100 idle-cost math. spheron.network ↩ ↩2 ↩3 ↩4 ↩5 ↩6 ↩7 ↩8
-
ScaleOps, "How to Deploy vLLM on Kubernetes: The Complete Guide to LLM Inference in Production," June 29, 2026. The two-layer scaling model (KEDA replicas, Cluster Autoscaler/Karpenter nodes), PagedAttention and continuous batching, the cold-start cost of new replicas, and the six-minute L4 node provision. scaleops.com ↩ ↩2 ↩3 ↩4 ↩5 ↩6 ↩7
-
Amazon EKS User Guide, "Autoscale AI inference with HPA and KEDA." The official walkthrough scaling a vLLM Deployment on queue depth (primary) and p95 end-to-end latency (SLO guardrail), with activation thresholds and stabilization windows. docs.aws.amazon.com ↩ ↩2 ↩3 ↩4
-
PremAI, "Deploying LLMs on Kubernetes: vLLM, Ray Serve & GPU Scheduling Guide (2026)." Cold-start durations for cached and uncached weights, KEDA scale-to-zero, Karpenter on-demand and spot fallback, and the four inference metrics worth monitoring. premai.io ↩ ↩2
-
Spheron, "GPU Cold Start on Serverless LLM Inference: 4 Fixes That Actually Work," 2026. The four-phase cold-start anatomy, image slimming from 15-18 GB to 5-7 GB, safetensors weight streaming, CUDA graph cache persistence, CRIU checkpoint restore, and NVMe-versus-NFS weight loading. spheron.network ↩ ↩2 ↩3 ↩4 ↩5
-
Wang et al., "HydraServe: Minimizing Cold Start Latency for Serverless LLM Serving in Public Clouds," arXiv 2502.15524. The production cold-start measurement (first token over 40 seconds versus roughly 30 ms per token warm) and reported 1.7x-4.7x cold-start reductions. arxiv.org ↩