


Your agent just spent 45 seconds answering a simple question. Was it the model, a slow tool call, or a retry loop burning the time? With a traditional stack you cannot tell, because every LLM interaction kicks off a chain of model calls, tool invocations, and token exchanges that standard monitoring never records 1.
Here is the sharper problem. Agents do not usually fail loudly. They fail while looking like they succeeded: the output is well formed, the run completes, the dashboard stays green, and the agent quietly called the wrong tool, retrieved the wrong document, or reasoned its way to a confident wrong answer 2. McKinsey's survey found 88% of organizations use AI somewhere and most are experimenting with agents, yet fewer than 10% have scaled agentic AI to production. The thing that separates the pilots from the deployments is usually the ability to see what the agent actually did 2.
This is a DevOps article, not an AI one. It is about the telemetry layer under your agents. In 2026 that layer standardized on OpenTelemetry's GenAI conventions, and any team shipping an agent to production needs to instrument against them, or it is debugging a black box by re-running prompts and hoping.
Why standard APM misses agents
Application performance monitoring assumes a deterministic system. Same input, same output, and failures show up as errors, latency spikes, or downtime. An agent is the opposite 2. Its execution path is non-deterministic: the same user request can produce completely different chains of tool calls depending on what the model decides, so you cannot predict the trace shape in advance 3.
Four things in particular break the old model 3. Token costs are invisible to an APM that watches HTTP: an agent that stuffs your entire database schema into context and burns 50,000 tokens costs real money, and standard APM never surfaces that. Tool call chains create deep, branching traces, where an agent calls a search tool, parses results, calls a code tool, fails, retries with different parameters, then switches tools entirely, and a rigid span hierarchy gets messy fast. Latency is wild: an LLM call can take 200 milliseconds or 30 seconds depending on output length, model load, and provider health, so percentile-based alerting needs different thresholds than a web service. And the failures are semantic rather than structural: a binary up-or-down health check tells you nothing about an agent that ran perfectly and did the wrong thing 2.
That last one is why observability, not monitoring, is the right frame. You cannot alert your way out of an agent that answers every time and is right only most of the time. You have to see the reasoning that produced the answer.
The common vocabulary: OpenTelemetry GenAI conventions
The fix is a shared vocabulary. OpenTelemetry's Semantic Conventions for Generative AI standardize how GenAI operations are recorded: the model being called, input and output token counts, and, when you opt in, the full content of prompts, completions, tool calls, and tool results 1. They define a set of gen_ai.* span and metric attributes, and their value is portability 2. Any instrumentation library can emit them and any backend can read them, so you are not locked into one vendor's trace format. The conventions are still evolving and increasingly adopted, and choosing them now is the difference between portable telemetry and a migration project later 2.
To see what they look like, you do not have to build anything. Several coding assistants already emit OTel telemetry. VS Code Copilot sends traces, metrics, and events for every agent interaction 1. OpenAI Codex exports structured log events and OTel metrics for API requests, tool calls, and sessions 1. Claude Code exports metrics and log events via OTel, with trace support in beta 1. That matters: the standard is live in tools millions of developers already run, not a spec waiting for adoption.
The conventions also set a sensible privacy default. Out of the box, no prompt content or tool arguments are captured, only metadata like model names, token counts, and durations, because prompts and tool payloads can contain sensitive data 1. Enabling content capture populates span attributes with full messages, system prompts, tool schemas, tool arguments, and tool results, which is powerful for debugging and dangerous if you are not careful where it lands 1.
What to instrument: the span model
The unit of observability for an agent is the step, not the response 2. You capture each model call, tool invocation, retrieval, and reasoning hop as its own span, with inputs, outputs, latency, and the decision that led to the next step, then assemble them into a hierarchical trace you can replay end to end 2.
The concrete shape is simple. Wrap the entire agent run in a root span, then add a child span for every LLM call and every tool call 3. Each LLM span records the model, message count, the token usage from the API response, and a duration. Each tool span records the tool name, parameters, and a success flag, and sets an error status when the call fails 3. When an agent produces a wrong answer, that trace is what tells you whether the planner misrouted, the retrieval missed, or the tool returned garbage 2.
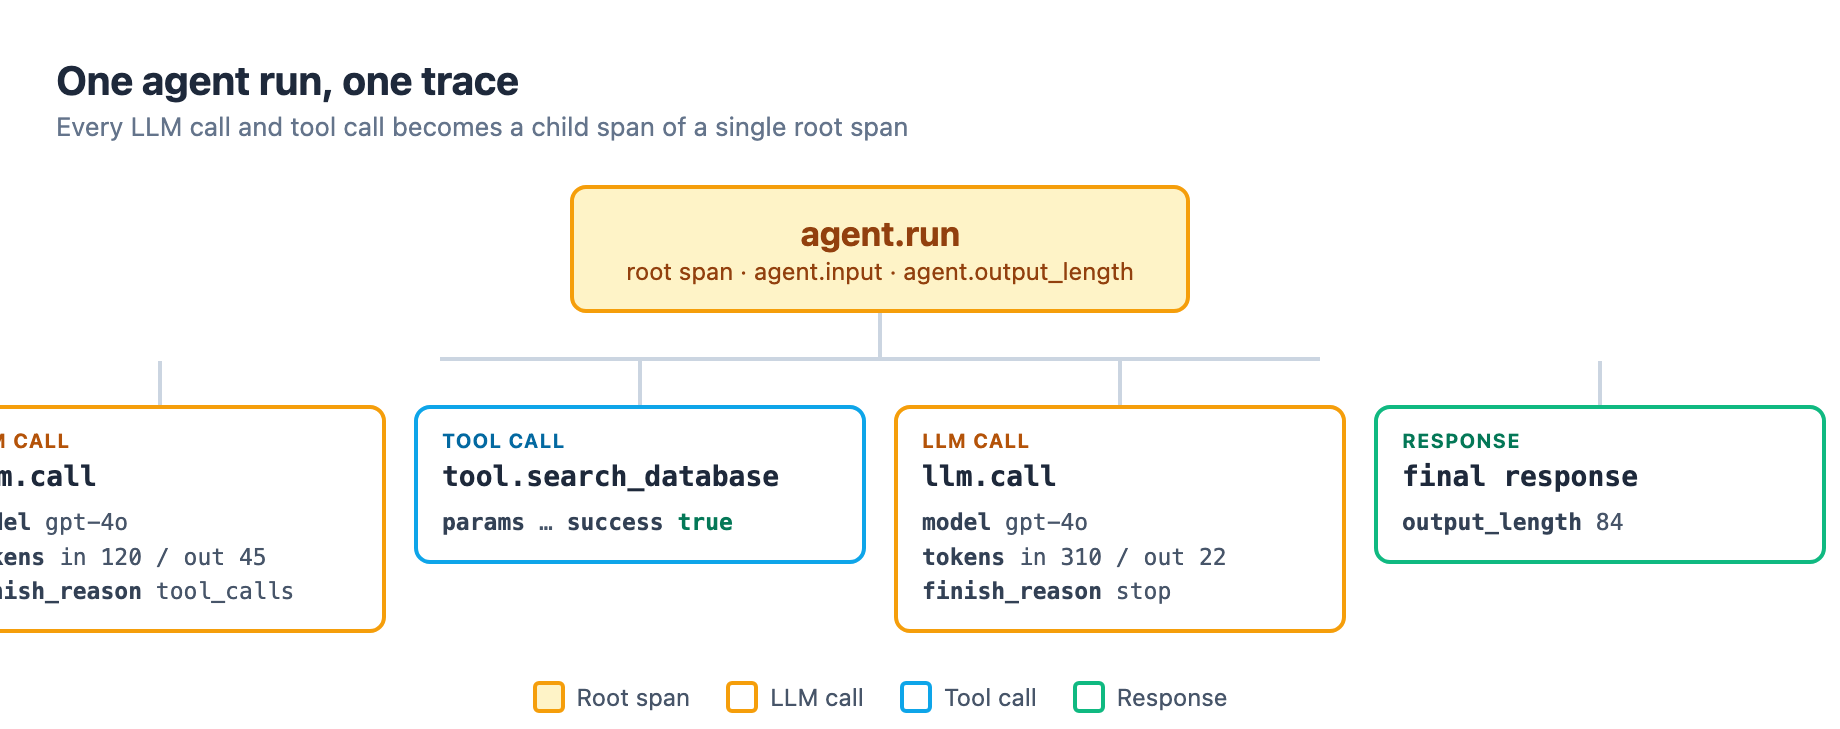
The gen_ai attributes carry the details. A span records gen_ai.request.model for the model (for example gpt-4o), gen_ai.usage.input_tokens and gen_ai.usage.output_tokens for each call, and gen_ai.response.finish_reasons for why the model stopped, whether a clean stop or a tool_calls request to keep going 41. That finish reason is a useful signal: an agent that keeps requesting tool calls and never converges shows up the moment you look at the trace.
The six metrics that matter
Traces tell you what happened on one run. Metrics tell you how the fleet behaves. Once telemetry is flowing, six are worth tracking 3. Token usage per agent run is your cost metric, so track it as a histogram you can sum across runs. Estimated cost in dollars per run, computed from token counts against current pricing, turns that into a budget you can alert on. LLM latency per call is only meaningful normalized by output, because a 10-second response generating 2,000 tokens is fine; measure tokens per second, not raw wall time 3. Tool success and failure rates show you which integration is the weak link in the chain. Retry counts separate a transient blip from a retry loop that is burning tokens. And model version, so when your provider rolls out a new version you can see whether behavior changed 3.
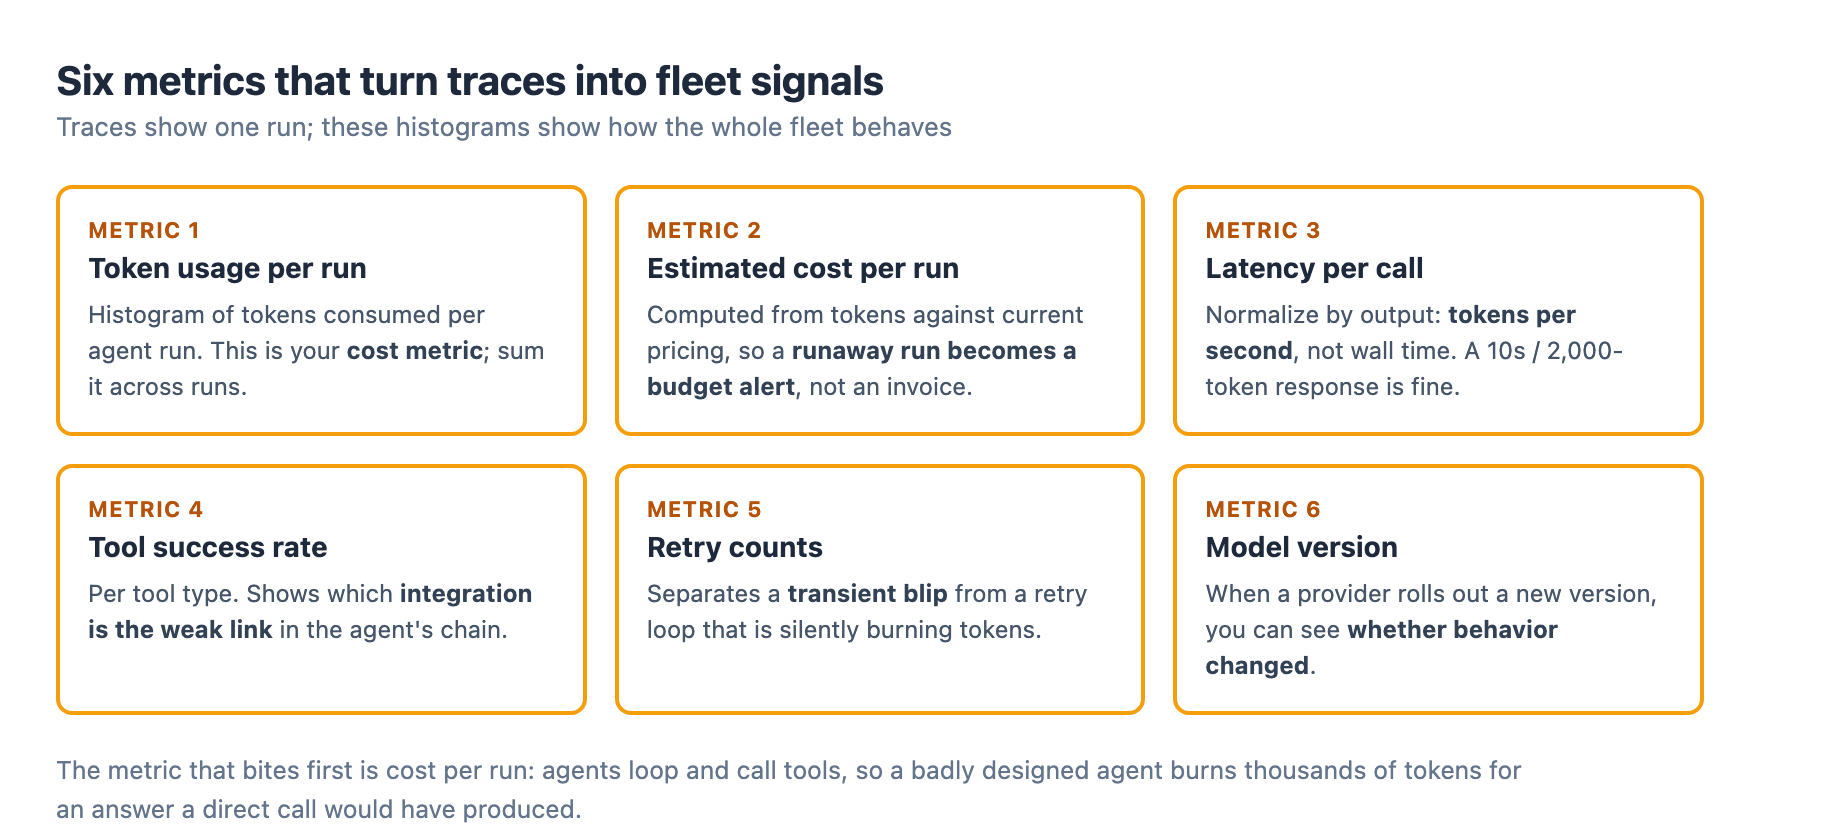
Two deserve emphasis because they are the ones teams find out about on the invoice. Agents are expensive in a way single LLM calls are not, because they loop and call tools repeatedly, and one badly designed agent can burn thousands of tokens reaching an answer a direct call would have produced 2. Track cost per run and token efficiency by tool type, and alert on runaway runs the way you would alert on a memory leak. A runaway agent is a budget incident 2.
Observe the whole chain, then evaluate quality
A prompt-level view shows you one model call in isolation. An agent's behavior lives in the relationships between steps: the user intent, the planner's decision, the routing to a sub-agent, the tool calls, and the final outcome 2. Trace the full chain and tie each step back to the data it touched and the policy it operated under, so a failure can be traced to its actual cause rather than the step where it became visible. In multi-agent systems this is not optional, because the failure and the symptom are often in different agents 2.
Uptime is also the wrong success metric for an agent. Observability has to answer whether a run was good, not only whether it ran 2. Attach evaluations to trace steps that score accuracy, completeness, and alignment with your policies, combine automated scoring with human review on the cases that matter, and feed failures back into a dataset so the same mistake becomes a regression test 2. An agent that responds 100% of the time and is right 70% of the time is a 70% agent, and only evaluation tells you which 30% it is getting wrong 2. The tool landscape split along this line in 2026: LangSmith, Langfuse, Arize Phoenix, Braintrust, and Confident AI trace and score agent runs, with Langfuse and Phoenix favored by teams wanting open-source or OpenTelemetry-native options, while Datadog LLM Observability ties model signals to the rest of your infrastructure 25.
Govern the traces and price the telemetry
Agent traces are not innocent logs. They capture the prompts users typed, the documents the agent retrieved, the arguments passed to tools, and the model's reasoning, which means they routinely contain personal data, secrets, and regulated content 2. Mask and redact sensitive fields, record every guardrail decision and override for the audit trail, and store traces from a regulated jurisdiction where the regulator allows 2. The governance layer for agent telemetry deserves the same rigor as the agent itself.
The quiet cost is the telemetry data. Instrumenting every step is the right call, and it means an agent that used to emit one log line now emits a structured trace of twenty spans, each with prompts, tool payloads, and reasoning attached 2. Multiply that by a fleet running continuously and the telemetry alone becomes a meaningful share of the backend bill before anyone has evaluated a single trace 2. The answer is to process the telemetry where it is generated: filter and aggregate spans, sample high-volume low-value traces, and drop or metricize noise before it reaches the backend. Source-side processing commonly removes 50 to 70% of telemetry volume while keeping the traces that matter 2. For agents at the edge, process locally so observability survives intermittent connectivity and sensitive data never leaves the site, the same pattern that makes self-hosted model infrastructure a fit for regulated workloads 2.
Where to start
You do not need a new vendor to begin. Any OTLP-compatible backend can receive GenAI telemetry, and OpenTelemetry's walkthrough uses the Aspire Dashboard, a free, open-source telemetry viewer that ships as a Docker container and accepts OTLP directly, with a built-in trace viewer, metrics explorer, and structured logs page 1. Run it, point an instrumented agent at localhost, and you are looking at real spans the same afternoon.
The practical sequence follows the same shape we use for our own pipeline at Adroit: instrument first, then gate, then evaluate. Add the OpenTelemetry SDK to your agent, wrap the run, the LLM calls, and the tool calls in spans, and export to any OTLP endpoint. Turn on content capture only where you need it, and always with redaction in front of it. Stand up the six metrics and alert on the runaway-cost one first. Then, once you can see the traces, attach evaluations so the runs that fail stop being anecdotes and start being regression tests.
The agents are already in production. The question is whether you can see what they are doing 3. The teams that can, ship. The ones that cannot, buy the lesson one invoice at a time.
Sources
-
OpenTelemetry, "Inside the LLM Call: GenAI Observability with OpenTelemetry" (May 14, 2026). opentelemetry.io ↩ ↩2 ↩3 ↩4 ↩5 ↩6 ↩7 ↩8 ↩9
-
Expanso, "AI Agent Observability: Best Practices in 2026" (Jun 23, 2026). expanso.io ↩ ↩2 ↩3 ↩4 ↩5 ↩6 ↩7 ↩8 ↩9 ↩10 ↩11 ↩12 ↩13 ↩14 ↩15 ↩16 ↩17 ↩18 ↩19 ↩20 ↩21 ↩22 ↩23
-
OneUptime, "How to Monitor AI Agents in Production with OpenTelemetry" (Mar 14, 2026). oneuptime.com ↩ ↩2 ↩3 ↩4 ↩5 ↩6 ↩7 ↩8
-
OpenTelemetry, Semantic Conventions for Generative AI. opentelemetry.io ↩
-
Confident AI, "Top 8 AI Agent Observability Platforms for 2026". confident-ai.com ↩